Real Estate MarketFeatured
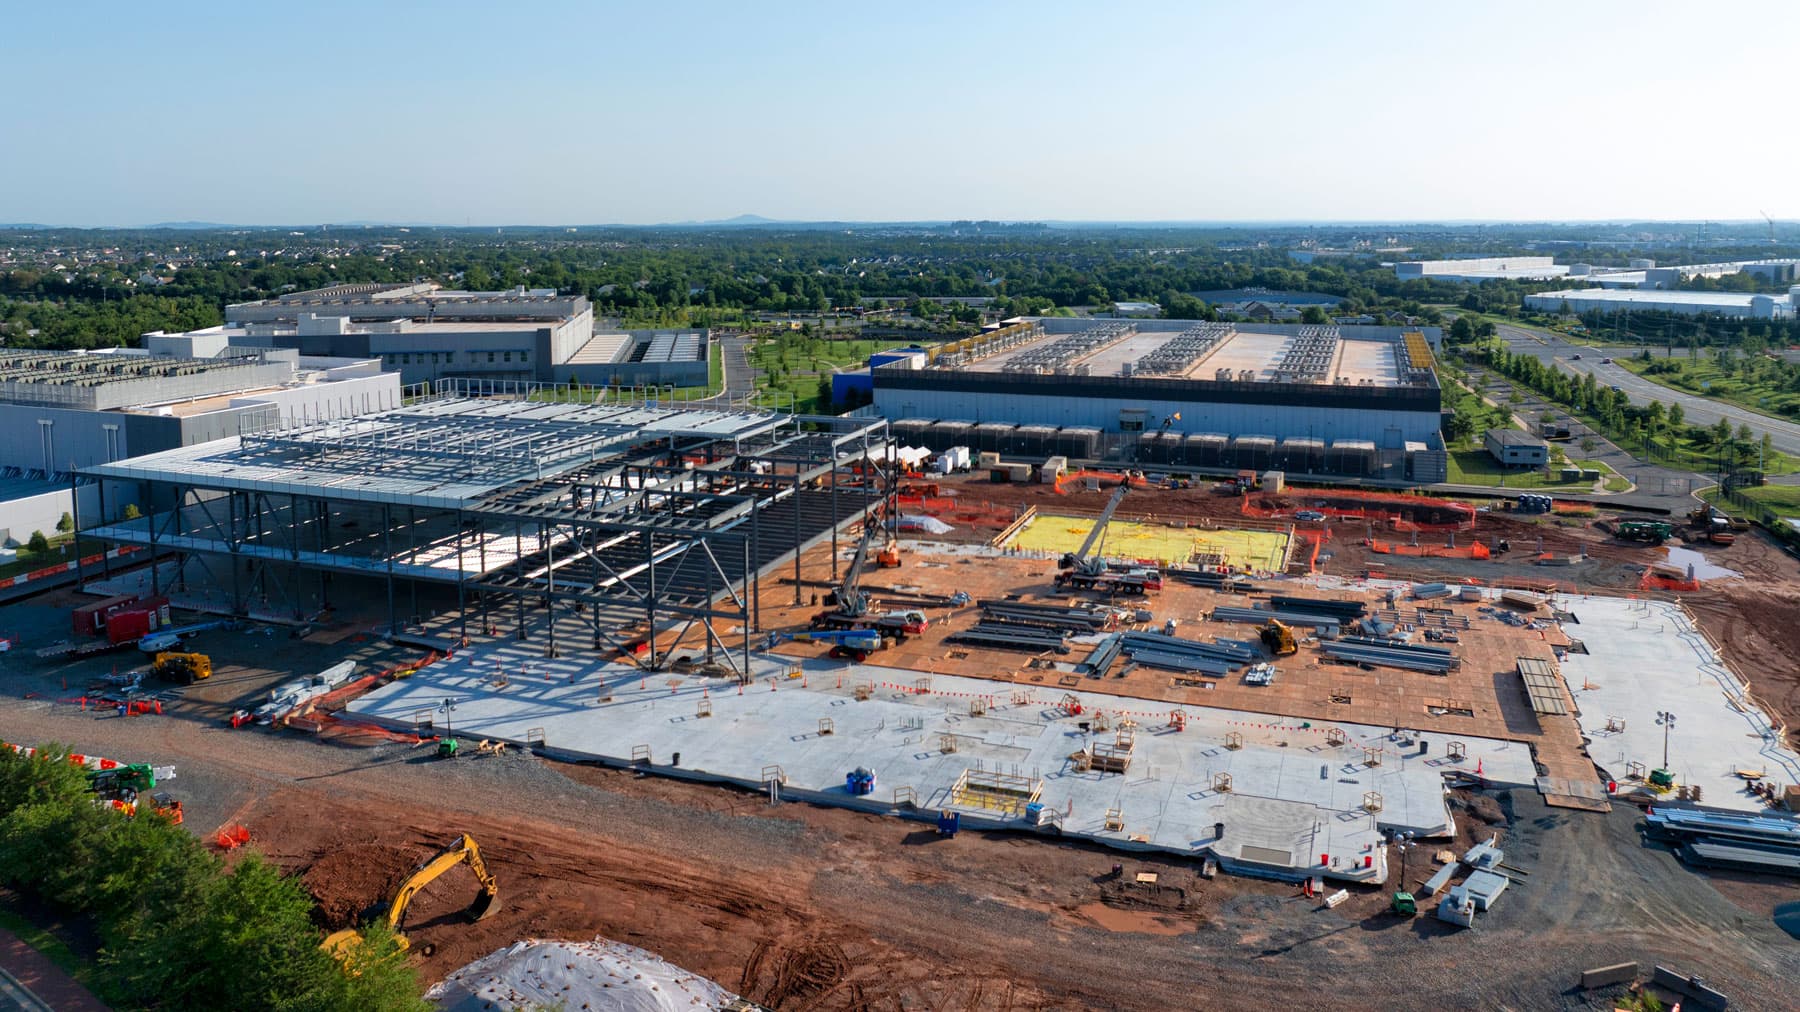
Data centers are outbidding home builders for land
Data centers are outbidding home builders at up to 50x the county land median. What that does to housing supply, and what residential developers can still control.
The housing market is the system that sets what a home costs to buy and to carry, priced not only by supply and mortgage rates but by builder incentives, insurance, land competition and the local rules that decide what can be built.
This coverage tracks the machinery underneath a housing market: the mortgage rate a buyer is quoted, the incentive a builder pays to reach it, the insurance premium folded into the monthly payment, the land a developer can still afford to bid on, and the policy that decides what may be built on it. The reporting is anchored in dated figures from named sources, among them the National Association of Realtors, the National Association of Home Builders, Freddie Mac, LendingTree, First Street, Parcl Labs and the New York City Comptroller.
Much of the reporting collected here follows the United States, because that is where the numbers are published on a fixed cadence and where the arguments are being tested first. The mechanics travel. A rate buydown, an insurance renewal, a structural review that stops a conversion and a code rule that forbids a single stair all do the same thing: they move what a buyer can pay, long before anyone writes a campaign. Read it newest first, or start with whichever variable is repricing your pipeline.
Updated Aug 04, 2026 · 16 articles
Data centers are outbidding home builders at up to 50x the county land median. What that does to housing supply, and what residential developers can still control.
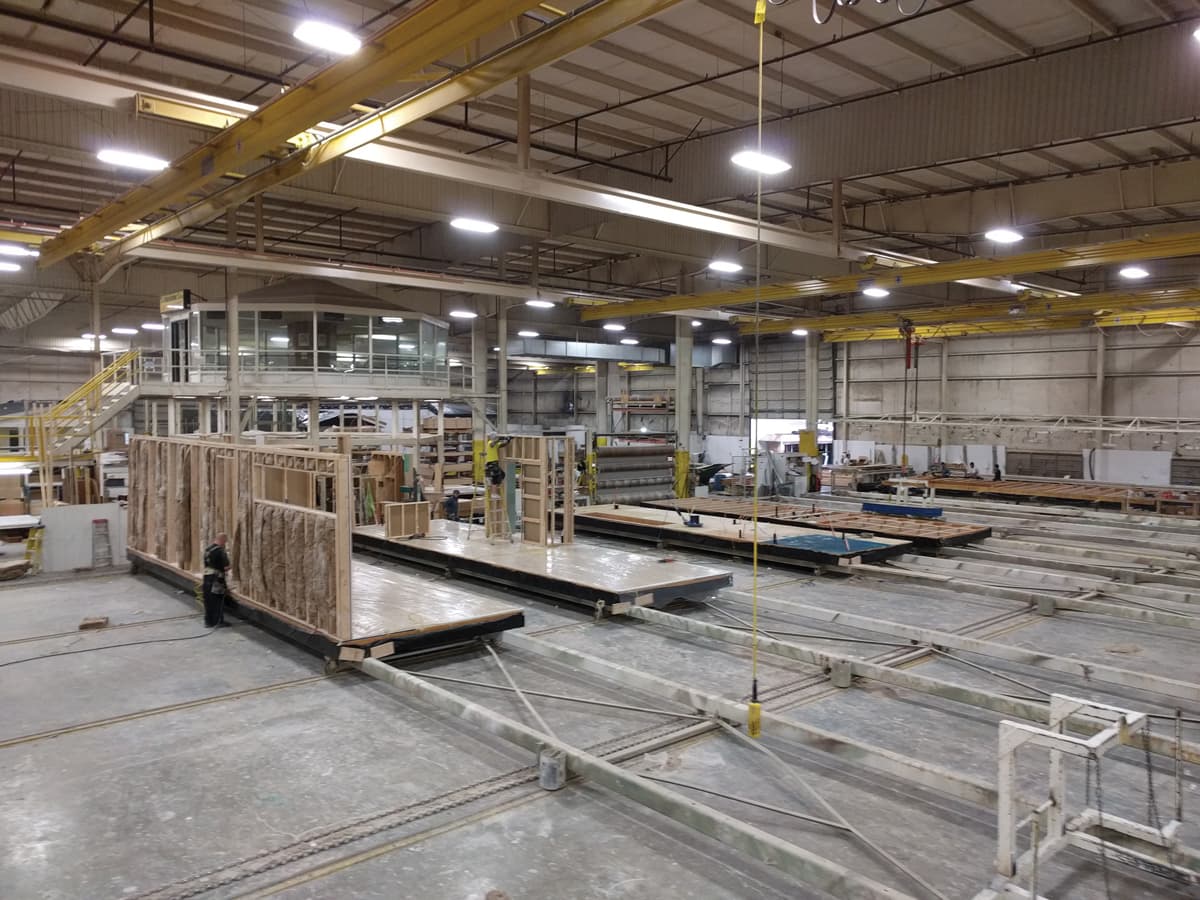
The 21st Century ROAD to Housing Act carries 56 provisions. The one that changes a real cost is a chassis rule, not zoning reform.

Office-to-residential conversion was the rare housing consensus. Then columns buckled at 235 East 42nd Street and three New York sites went quiet.
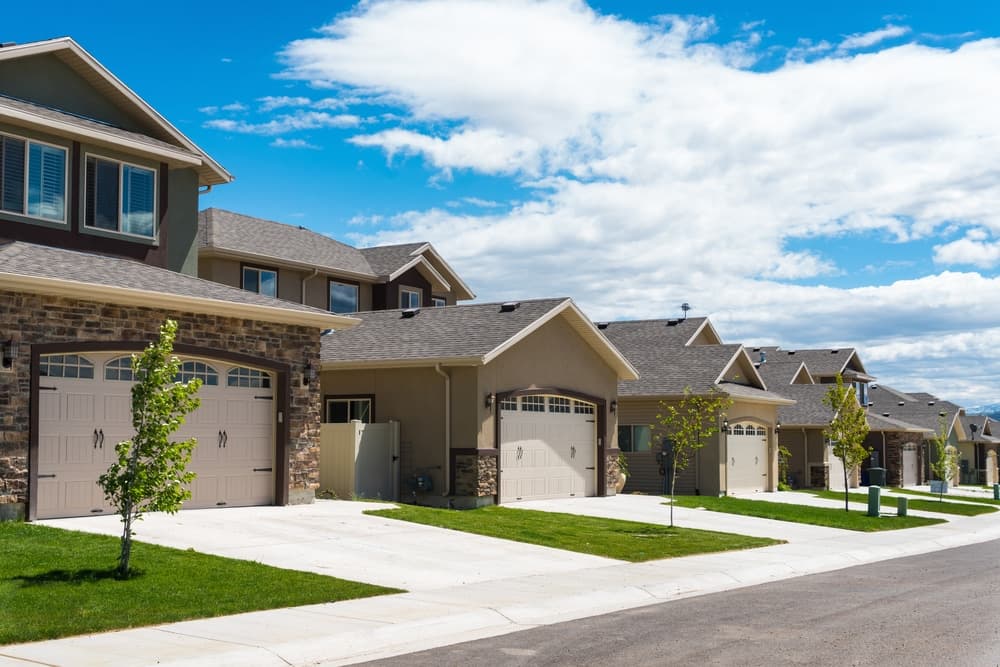
Institutional landlords turned net sellers of single-family homes in 2026. The math removes rental supply exactly where rents are already climbing.
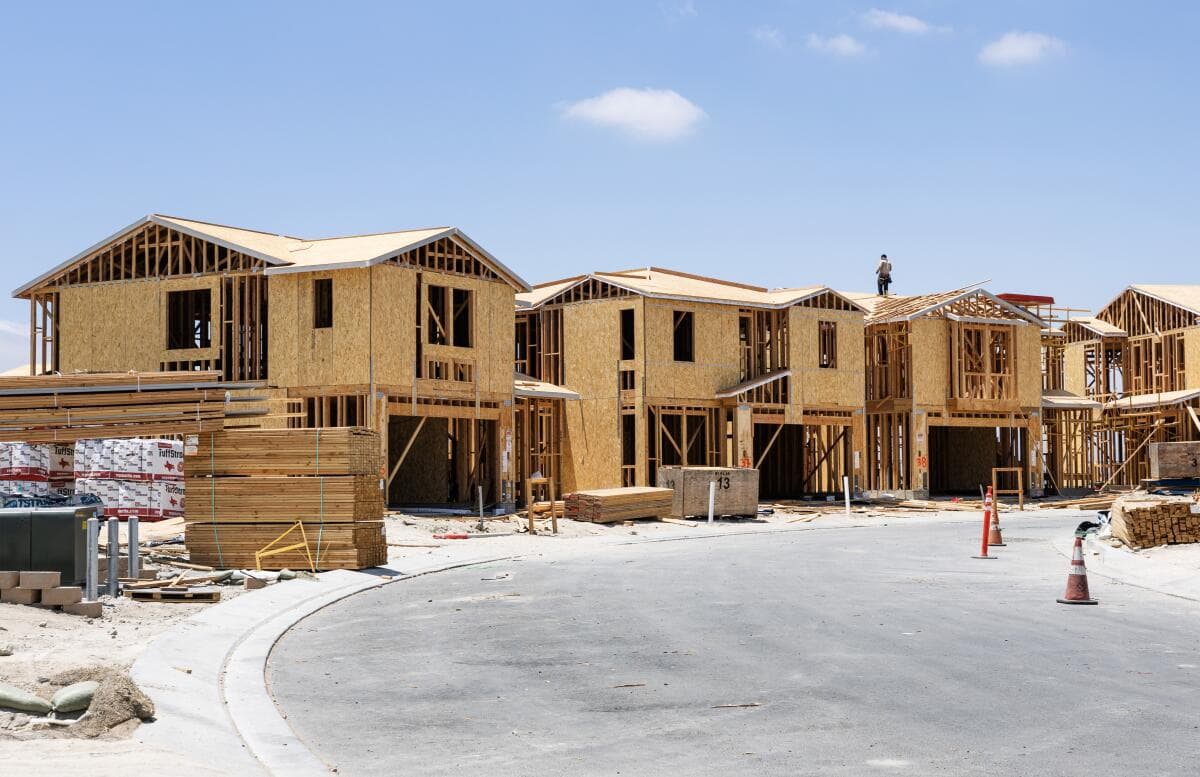
Builder incentives now run 63% of US homebuilders and 10.9% of sale price at Pulte. The discount stopped being a promotion and became the price.

Home insurance now takes 8.5% of monthly housing costs and beats property taxes in 15 states. It stopped being a line item and became underwriting.

A Midtown conversion buckled in July 2026. At $500 per gross square foot, office-to-residential conversion math was already thin. Now lenders are rereading it.

The 21st Century ROAD to Housing Act became law in July 2026. What its 43 provisions actually change for developers, investors and homebuyers.
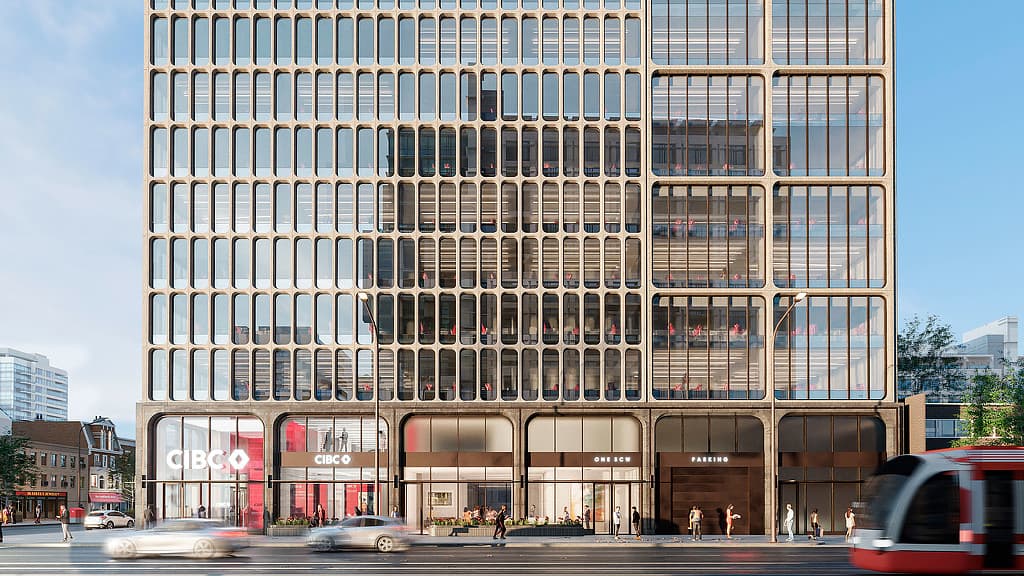
Office-to-residential conversions hit a record 90,300-unit pipeline in 2026, up 28%. Do the economics work — and can they dent the housing shortage?
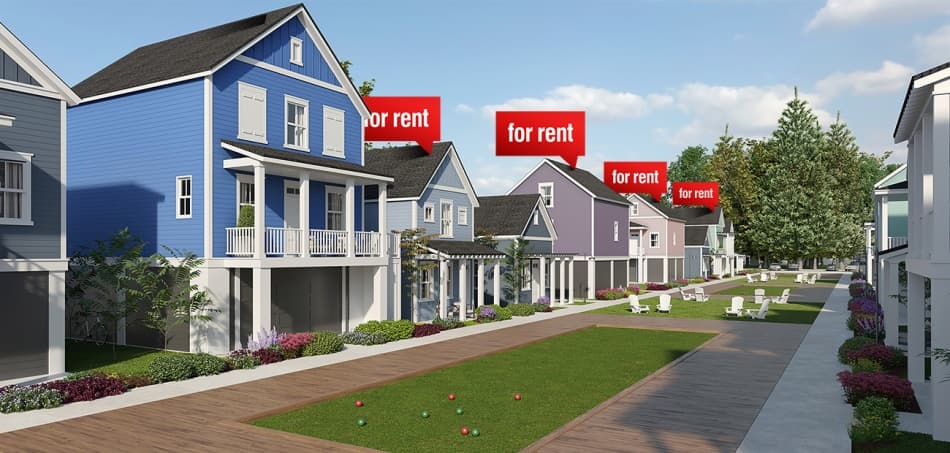
Build-to-rent went from 2.7% to 7% of single-family starts — then Washington moved to curb it. Why the 2026 housing fight gets the target wrong.

Climate risk is now priced into US home values and insurance — with $1.47 trillion at stake. Why resilience is becoming a brand promise developers must own.
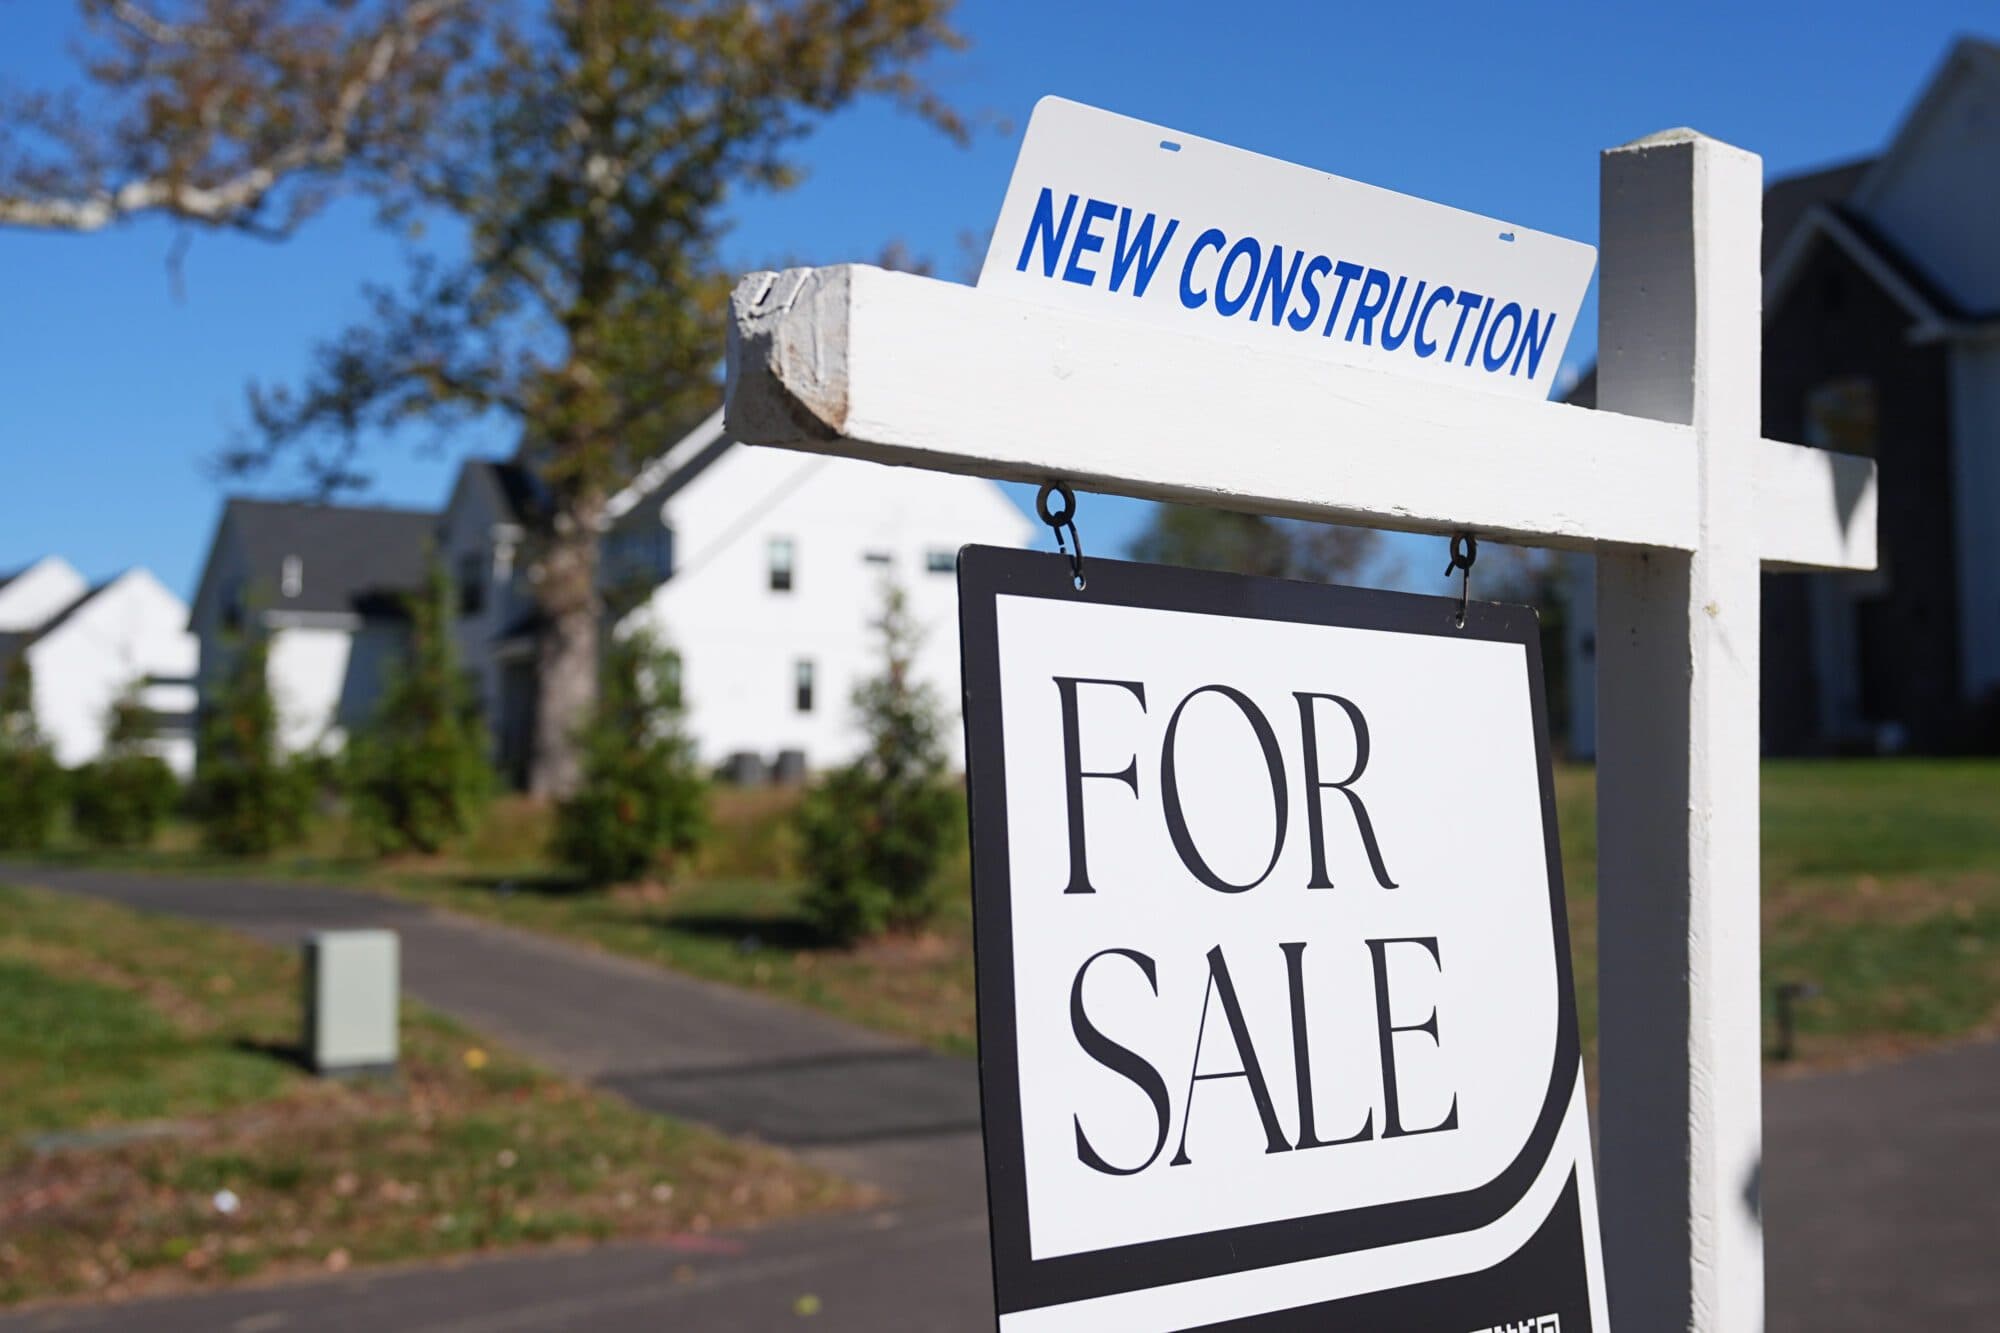
US mortgage rates dipped below 6.5% in June 2026 while the Fed held and pushed cuts to 2027. What it means for buyers and the housing market.
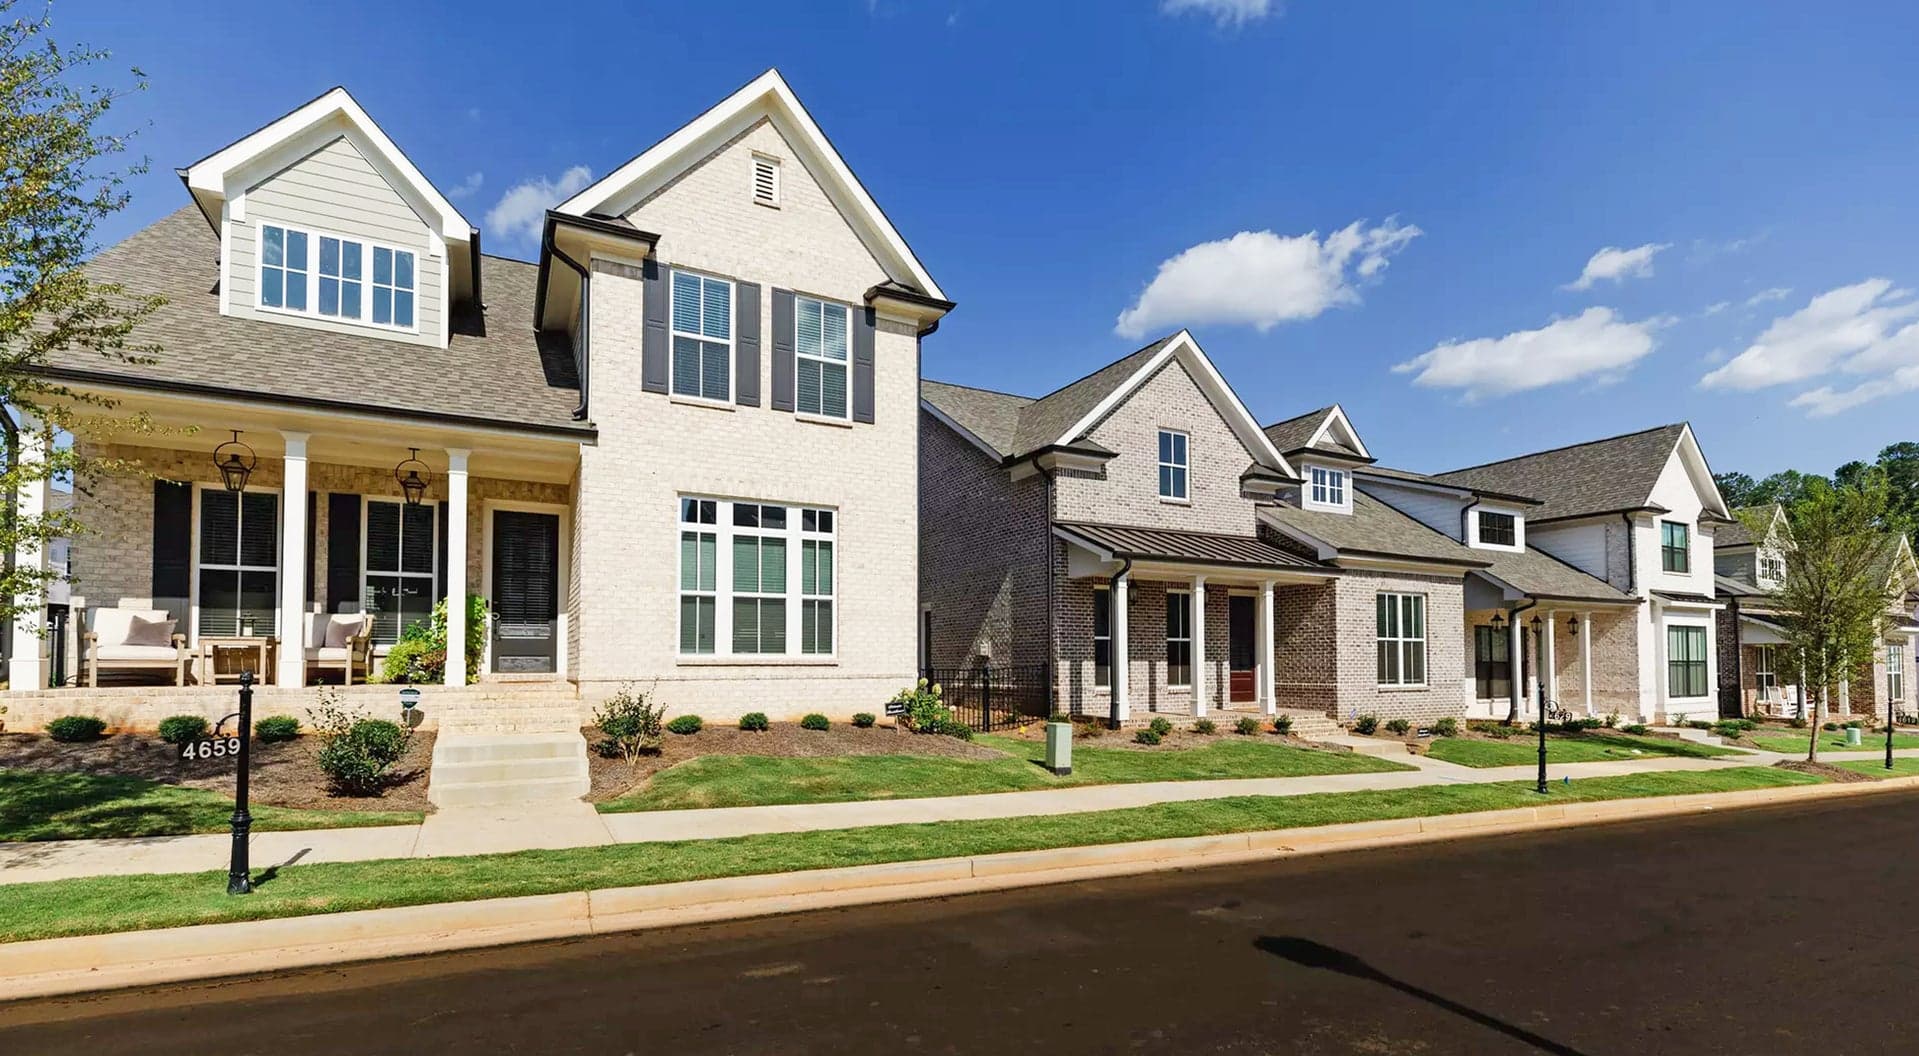
Big US homebuilders are buying the entry-level market in 2026 with rate buydowns resale sellers cannot match. How the incentive economy works.
First-time homebuyers fell to a record-low 21% of the US market. Mortgage rates, down payments, buydowns and how to make the math work in 2026.
Mortgage rate buydowns now drive US new-home sales in 2026, with PulteGroup spending over $50K per deal. Are builder incentives worth it for buyers?
First-time buyers hit a 44-year low of 21% share in the US market. With rates at 6.53% and prices up 60% in six years, here is the math for 2026.
Because builders must clear inventory and existing owners do not. Census figures put the median new US home at $403,200 in April 2026 against $404,600 for an existing one, a negative new home premium for the first time in five decades of data. Locked-in low mortgage rates keep resale supply scarce and seller expectations high, while builders discount, mostly through financing, to move standing stock.
Because a dollar spent on financing moves the monthly payment much further than a dollar cut from the price. A $5,000 price reduction saves a buyer roughly $24 a month, while a 2-1 buydown on a $400,000 loan costs about $8,600 and cuts around $450 a month in year one. Cutting the recorded price also resets comparable sales across the whole community.
About 8.5% of a typical mortgaged homeowner's monthly housing cost in the United States, roughly $200 out of $2,354, per LendingTree's analysis of February 2026 data. In 15 states insurance now exceeds property tax, reaching an estimated $284 a month against $143 in Tennessee. For income assets the effect compounds: at a 5.5% cap rate, an extra $1,000 per unit in annual premium removes roughly $18,000 per unit of value.
Locally yes, nationally not yet. The US conversion pipeline held 90,300 units at the start of 2026, real supply but small against a shortage measured in millions. The New York City Comptroller models conversion at $500 per gross square foot including financing and excluding land, and a SPUR and ULI San Francisco study put West Coast conversions at $472,000 to $633,000 per unit before seismic work.
Not measurably on purchase prices. The eight largest institutional single-family landlords tracked by Parcl Labs were net sellers of 3,011 homes in the second quarter of 2026, a rounding error against 92 million US single-family homes. The effect lands on rents instead: multifamily rents fell 1.7% year over year through February 2026 while single-family rents rose in 49 of the 50 largest metros. John Burns Research and Consulting nicknamed the bill the Rental Inflation Bill.
Rates, insurance and supply set what a buyer can pay at every price point. The luxury and prime coverage follows the same mechanics where cash, scarcity and wealth migration price the asset instead.
Luxury and prime real estate